Project Title
Public Review DRAFT Big Green Lake TWA WQM PLAN 2017 (UF07)
Andrew Hudak, Water Quality Biologist
Big Green Lake TWA WQM Plan (PDF Format)
Study Purpose & Setting
The overall goal of this plan is to improve and protect water quality in the basin. This Targeted Watershed Assessment (TWA) monitoring project provided substantial data to analyze current conditions and to make recommendations for future management actions in the area. This plan is designed to present monitoring study results, identify issues or concerns in the area found during the project and to make recommendations to improve or protect water quality consistent with Clean Water Act guidelines and state water quality standards.
This TWA project addressed needs for a baseline water quality assessment of the Big Green Lake Watershed. Repeatable biological, inorganic chemistry and habitat surveys provide valuable information for future comparison. This project filled data gaps from the 2011 Assessment Report of Hill, Roy, and Wuerches Creeks (Johnson et. al. 2011) (2011 Assessment). Together with the 2011 Assessment, the data collected in this project can be compared to future surveys to evaluate the effectiveness of Best Management Practices (BMPs) installed in the watershed.
Management Priorities
Work with landowners and county partners in the watershed to encourage restoration of stream banks and reduction of erosion is a high priority.
Maximize buffers or protected areas along streams with steep slopes should be a high priority for this area due to the nature of the steep slopes in the watersheds of the creeks in this project.
Explore the use of forested and native grass buffers compared to grassed buffers to increase the nutrient reduction.
Capitalize on the efforts of the Wisconsin DNR, Green Lake County LCD, Green Lake Sanitary District, Green Lake
Association, NRCS, and USGS in these subwatersheds by implementing BMPs (stream bank restoration, sediment basins, vegetative buffers, etc.) where needed will likely have a significant improvement of the water quality in the creeks in this project and Big Green Lake.
Resources
Watershed Overview
The Big Green Lake Watershed (UF07) is located primarily in Green Lake County, but extends east into Fond du Lac County and edges just a bit into the southwestern corner of Winnebago County. The watershed is 68,676 acres in size and contains 141 miles of streams and rivers, 655 acres of lakes and 5,102 acres of wetlands. This TWA focuses on the southern and eastern portion of the watershed.
Population, Land Use
At the time of the 2010 Census, the Wisconsin Population Lab determined the Big Green Lake Watershed hosted 12,429 inhabitants. The majority of the land cover in the Big Green Lake Watershed is Agriculture (65%) followed by Open Land and Water (15.53%). Forest also covers a sizeable portion of the watershed (8.76%) followed by Wetlands, which 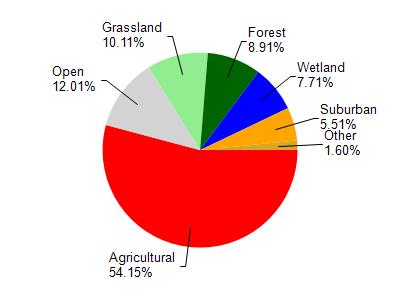 constitute approximately five and three-quarters of the watershed. The last reasonably sized land cover is Suburban (3.22%). The remainder of land cover constitutes slightly over one and a half percent of the total land cover; these include Urban (0.87%), Grassland (0.81%) and Barren (.07%).
Outstanding and Exceptional Resource Waters
Wisconsin has designated many of the state?s highest quality waters as Outstanding Resource Waters (ORWs) or Exceptional Resource Waters (ERWs). Waters designated as ORW or ERW are surface waters which provide outstanding recreational opportunities, support valuable fisheries and wildlife habitat, have good water quality, and are not significantly impacted by human activities. ORW and ERW status identifies waters that the State of Wisconsin has determined warrant additional protection from the effects of pollution. Two waters in the watershed are exceptional resource waters, Assemble Creek and White Creek.
Trout Waters
DNR uses three categories to classify the different types of trout streams throughout Wisconsin. These are evident in Wisconsin Trout Stream Maps, which provides a comprehensive list of trout streams and a set of trout stream maps covering the majority of the state. Efforts have been made to list all trout streams in the State of Wisconsin, but it is recognized that this listing in not exhaustive. White Creek, Silver Creek, Silver Creek, Dakin Creek.
Impaired Waters
Every two years, Section 303(d) of the Clean Water Act requires states to publish a list of all waters that do not meet water quality standards. The list, also known as the Impaired Waters List, is updated to reflect waters that are newly added or removed based on new information. Impaired waters in this watershed are impaired for historical discharges, mine tailings, and runoff issues. Impaired Waters in Watershed
Big Green Lake (UF07)Ecological Landcapes
The Big Green Lake Watershed is covered by two ecological landscapes: the Southeast Glacial Plains and the Central Sand Hills. The Southeast Glacial Plains Ecological Landscape makes up the bulk of the non-coastal land area in southeast Wisconsin. This Ecological Landscape is made up of glacial till plains and moraines. Most of this Ecological Landscape is composed of glacial materials deposited during the Wisconsin Ice Age, but the southwest portion consists of older, pre-Wisconsin till with a more dissected topography. Soils are lime-rich tills overlain in most areas by a silt-loam loess cap. Agricultural and residential interests throughout the landscape have significantly altered the historical vegetation. Most of the rare natural communities that remain are associated with large moraines or in areas where the Niagara Escarpment occurs close to the surface.
Historically, vegetation in the Southeast Glacial Plains consisted of a mix of prairie, oak forests and savanna, and maple-basswood forests. Wet-mesic prairies, southern sedge meadows, emergent marshes, and calcareous fens were found in lower portions of the Landscape. End moraines and drumlins supported savannas and forests. Agricultural and urban land use practices have drastically changed the land cover of the Southeast Glacial Plains since Euro-American settlement. The current vegetation is primarily agricultural cropland. Remaining forests occupy only about 10% of the land area and consist of maple-basswood, lowland hardwoods, and oak. No large mesic forests exist today except on the Kettle Interlobate Moraine which has topography too rugged for agriculture. Some existing forest patches that were formerly savannas have succeeded to hardwood forest due to fire suppression.
The Central Sand Hills Ecological Landscape is located in central Wisconsin at the eastern edge of what was once Glacial Lake Wisconsin. The landforms in this Ecological Landscape are a series of glacial moraines that were later partially covered by glacial outwash. The area is characterized by a mixture of farmland, woodlots, wetlands, small kettle lakes, and cold water streams, all on sandy soils. The mosaic of glacial moraine and pitted outwash throughout this Ecological Landscape has given rise to extensive wetlands in the outwash areas, and the headwaters of coldwater streams that originate in glacial moraines. The growing season is long enough for agriculture but the sandy soils limit agricultural productivity. Historic upland vegetation consists of oak-forest, oak savanna, and tallgrass prairie. Fens were common in this Ecological Landscape and occurred along with wet-mesic prairie, wet prairie, and rare coastal plain marshes. Current vegetation is composed of more than one-third agricultural crops, and almost 20% grasslands with smaller amounts of open wetland, open water, shrubs, barren, and urban areas. The major forested type is oak-hickory, with smaller amounts of white-red-jack pine, maple-basswood, lowland hardwoods, aspen-birch, and spruce-fir.
Methods & Procedures
 Collection of TP, habitat, fish, continuous temperature, and aquatic macroinvertebrates used standard DNR data collection methods and samples were sent to certified laboratories in the state. No specific in-field duplicates, replicates or blanks were collected for the study; however quality assurance sampling procedures were used in the collection and preservation of samples for all parameters.
Total Phosphorus (TP) and Total Suspended Solids (TSS) All samples were collected using the standard DNR grab sampling method for a total of 90 samples (WDNR 2014). During the growing season of 2014, TP samples were collected by volunteers at 4 locations on the south side of Big Green Lake once per month from May through October. Additionally, TP and TSS samples were collected by volunteers at 11 locations in Silver Creek once per month from May through October 2014. All TP and TSS samples were shipped to Wisconsin State Laboratory of Hygiene (WISLOH) for analysis. The WISLOH entered all sample analysis data into monitoring database.
Macroinvertebrates Eighteen sites were sampled for aquatic macroinvertebrates in October 2014 in the Big Green Lake watershed. All sites were sampled using the DNR Guidelines for Collecting Macroinvertebrate Samples from Wadable Streams (2000). A D-shaped kicknet with micron mesh was used at all sites by standing upstream from the net and placing it firmly on the stream bed while digging into the substrate with the heel or toe to free the macroinvertebrates from the substrate. Riffles were targeted at each of the sites, but if none were present then overhanging vegetation, woody debris, or other vegetation would be sampled. This is done by jabbing the net into the vegetation to free the invertebrates.
For a representative sample of the aquatic macroinvertebrate community, a minimum of 100 aquatic macroinvertebrates collected in each sample was targeted. The aquatic macroinvertebrates were preserved in a 70-80% ethanol solution inside quart Mason jars. If necessary, multiple ?Mason? jars were used per sample depending upon how much sediment and organic material was collected with the aquatic macroinvertebrates. Within the next 24 hours, the samples were re-preserved with another 70-80% ethanol solution. Samples were taken to the University of Wisconsin-Stevens Point Aquatic Entomology Laboratory (UWSP AEL) for lowest possible taxonomic identification. Staff at the UWSP AEL entered the data into the SWIMS database between winter 2014 and summer 2015.
Fish Assemblage
Fifteen of the 18 sites were surveyed between July and September 2014 following the DNR Guidelines for Assessing Fish Communities of Wadable Streams in Wisconsin (2001). The fish assemblage was determined by a quantitative survey involving electroshocking a section of stream with a minimum station length of 35 times the mean stream width. All fish were collected, identified, and counted. All gamefish were measured for length. Stream flow and water chemistry was recorded at each site prior to conducting the fish survey. A 12 Volt, 18 Amp Hour battery-powered backpack shocker was used for 10 of 15 sites based upon the smaller stream width and depth. An otter sled stream shocker with a 4000 Peak Watt generator was used for 5 of 15 sites with appropriate stream width and/or depth. Catch per effort sampling procedures were used for this project (no particular species was targeted, all captured). A single upstream pass was made using .125 inch mesh nets to collect the fish. At the end of the station, captured fish were identified and counted and all game fish were measured for length. Once all data was collected, the fish were returned to the creek. Fish survey data was entered into the FHMD by DNR Water Resources staff.
Habitat
At 9 sites in the Silver Creek watershed, qualitative notes on average stream width and depth, riparian buffers and land use, evidence of sedimentation, fish cover and potential management options were also recorded. Habitat assessments were conducted following the DNR Guidelines for Evaluating Habitat of Wadable Streams (2002). DNR staff entered the qualitative habitat data into the DNR Fisheries and Habitat Management Database. On the south side of Big Green Lake, six creeks were surveyed for quantitative habitat. Habitat assessments were conducted following the DNR Guidelines for Evaluating Habitat of Wadable Streams (2002). Each habitat survey station length was 35 times the mean stream width of the survey station. Following the determination of station length, the station was divided into 12 transects. At each transect, substrate, sedimentation, erosion, water depth, and riparian land use data were collected. DNR staff entered the quantitative habitat data into the DNR Fisheries and Habitat Management Database.
Continuous Temperature
Continuous temperature data was collected at 9 sites in the Silver Creek Watershed in 2014. Temperature measurements were collected once per hour at each location from May through mid-October. Temperature measurements were taken with an Onset Hobo Pendant thermistor attached to a fence post driven into the stream bed of the creek. The thermistor was attached to the fence post in such a manner as to suspend the thermistor in the water column low enough to stay under water in low flow conditions and high enough to not get buried in bottom substrate (6 inches above the bottom). The thermistor was placed in a shaded location when possible.
Study Results
 Total Phosphorus
All inorganic chemistry samples were sent to the WISLOH in Madison for analysis. Two of the four creeks samples in the Southern Big Green Lake watershed had an average TP concentration (mg/L) exceeding the NR 102 wter quality criteria (WQC) for creeks and rivers of 0.075 mg/L. Wisconsin Consolidated Assessment and Listing Methodology (WisCALM 2018) requires a parametric statistical approach to assess creek TP data against the applicable water quality criterion found in NR 102. This approach involves the calculation of a 90% confidence limit around the median of a TP sample dataset. If the lower 90% confidence limit (LCL) exceeds the criterion for TP, then that creek segment (assessment unit) is considered to be exceeding the criterion. The LCLs were calculated for each creeks TP samples in the Southern Big Green Lake watershed. Three of the 4 creeks samples LCLs met the water quality criterion for TP, while 1 exceeded.
Two of the 4 Silver Creek sites TP LCLs exceeded the WQC (> 0.075 mg/L) while two met the WQC (< 0.075 mg/L). The headwaters of Silver Creek at County Hwy KK met the WQC. Just upstream of the Gothic Millpond at Hwy 44 the Silver Creek TP LCL exceeded the WQC. Below the Gothic Millpond, the Silver Creek TP samples met the WQC. At Koro Road, the WQC was exceeded by the Silver Creek TP samples. None of the Silver Creek TP LCLs overwhelmingly exceeded the WQC (>0.15 mg/L). The Silver Creek TP LCLs ranged from 0.0225 at County Hwy KK to 0.0925 mg/L above the Gothic Millpond. Four of the 7 tributary sites TP LCLs exceeded 0.075 mg/L while 3 met the WQC. The tributary LCLs ranged from 0.0245 mg/L at Site I to 0.1426 mg/L at Site E. None of the tributary TP LCLs overwhelmingly exceeded the WQC (>0.15 mg/L).
Total Suspended Solids
TSS samples were collected at each of the 4 Silver Creek Mainstem project sites during the same sampling events as TP. TSS samples were collected once per month from May through October 2014. Wisconsin does not have a water quality standard for TSS; however, this data provides useful information about the watershed, background information for future comparison, and additional support for adding these systems to the CWA 303d list for habitat degradation. The average TSS concentration for the Silver Creek Mainstem ranged from 5.3 mg/L at County Hwy KK to 33.3 mg/L at Hwy 44. TSS samples were collected at each of the 7 Silver Creek tributary sites during the same sampling events as TP. TSS samples were collected once per month from May through October 2014. The average TSS concentration for the Silver Creek tributaries ranged from 4.1 mg/L at Site I to 26.65 mg/L at Site C.
Macroinvertebrates
In October 2014, 7 streams were sampled for aquatic macroinvertebrate communities in the Southern Big Green Lake watershed. Some aquatic macroinvertebrate species are tolerant of environmental degradation, while some species are moderately tolerant, and some others are intolerant. Based upon the representative macroinvertebrate sample collected and their associated tolerance to environmental degradation, a Macroinvertebrate Index of Biotic Integrity (MIBI) was calculated to indicate the water quality condition of the stream. The MIBI scores ranged from 3.17 at Roy Creek upstream of County Hwy O to 4.65 at White Creek upstream of Spring Grove Road. The Condition Categories for the 8 sites were all Fair. All 7 streams demonstrated a macroinvertebrate community significantly impacted by environmental degradation.
Additionally, 11 streams were sampled for aquatic macroinvertebrate communities in the Silver Creek Watershed. The MIBI scores ranged from 1.71 at the Unnamed Tributary to Silver Creek upstream of Arcade Road to 4.54 at Silver Creek at Douglas Street. The condition categories for 10 sites were Fair, while Site F demonstrated a condition category of Poor. All 11 streams demonstrated a macroinvertebrate community significantly impacted by environmental degradation.
Habitat Survey
Between August and September 2014, quantitative habitat surveys were conducted at the 6 creeks in the Southern Big Green Lake watershed. Quantitative habitat assessments evaluate a representative stream reach (35 X Mean Stream Width) for the quantity and quality of habitat for game fish and compare the habitat to reference streams in Wisconsin. Based upon the assessment data collected during the 2014 surveys, a habitat rating was calculated for 6 creeks. The habitat rating scores were relatively similar for all creeks. The habitat rating scores ranged from 48 at the Unnamed Tributaries to White and Hill Creeks to 53 at Roy and Spring Creek. Five of the 7 surveys demonstrated a Condition Category of Good, with scores ranging from 50-53. The remaining survey stations (the two Unnamed Tributaries) scored a Fair Condition Category, with a score of 48. Between July and September 2014, qualitative habitat surveys were conducted at 9 locations in the Silver Creek watershed. Based upon the assessment data collected during the 2014 surveys, a habitat rating was calculated for all sites. The habitat rating scores ranged from 50 at tributary Sites E and I to 73 at the headwaters site of Silver Creek at County Hwy KK. All 9 surveys demonstrated a Condition Category of Good.
Fish Survey
Between July and September 2014, each of the creeks were surveyed for representative fish communities in the Southern Big Green Lake Watershed. Some fish species are tolerant of environmental degradation, while some species are moderately tolerant, and some others are intolerant. Based upon the representative fish collected during the survey and their associated tolerance to environmental degradation, an Index of Biotic Integrity (FIBI) was calculated to indicate the water quality of the creek. The FIBI scores ranged from 0 at the Unnamed Tributary to Hill Creek, to 50 at Spring Creek. The Condition Category for the 6 sites ranged from Poor to Fair. Four of the 6 surveys had a Condition Category of Poor, while the remaining 2 surveys had a Condition Category of Fair.
Additionally, between July and September 2014, the 9 sites were surveyed for representative fish communities in the Silver Creek Watershed. The FIBI scores ranged from 20 in the headwaters of Silver Creek to 100 in the Unnamed Creek at County Hwy FF. The condition category for the 9 sites ranged from Poor to Excellent. The fish survey in the Unnamed Creek at County Hwy FF had a condition category of Excellent, with the highest number of fish species (11) and total number of fish caught (1341). The Silver Creek fish survey below Gothic Millpond had a condition category of Good, with 10 species caught. Three of the 9 fish surveys indicated creeks having a condition category of Fair. The remaining four sites had a condition category of Poor based upon the fish surveys.
Each fish community in the Silver Creek Watershed surveyed was used to verify or update the modeled Natural Community for that stream segment. The modeled Natural Community for Silver Creek changes as you move from upstream to downstream. The headwater area of Silver Creek is modeled as a Cool-Warm Headwater Natural Community downstream to the west side of the City of Ripon. The modeled Natural Community changes to Cool-Warm Mainstem on the west side of Ripon until Silver Creek discharges into Big Green Lake. Each of the 6 tributary streams Natural Community was verified or changed based upon the fish caught in the survey (and any historical known surveys in that stream segment). Verifying or changing the modeled Natural Community was important since the Natural Community determines what FIBI was used to determine the water quality of that stream segment.
Continuous Temperature
Temperature data was collected from May through mid-October in 2014 at 9 locations in the Silver Creek Watershed. Four locations were monitored hourly in the Silver Creek mainstem. The temperatures in Silver Creek in general increased from upstream to downstream, except between the Gothic Millpond outlet and Koro Rd which showed a slight decrease in monthly average and maximum daily average temperatures. The decrease in temperature at Koro Rd is likely due to higher inputs of cooler groundwater into the creek as it flows through the City of Ripon. The upper portions of Silver Creek, in reference to the County Hwy KK location, are cold enough to support a Cool-Cold transitional fish community. This section of Silver Creek upstream of Hwy 23 on the east side of Ripon is currently identified as Class 2 Trout Waters, which means some trout reproduction may occur but stocking is necessary to maintain a desirable fishery (WDNR 2002). The maximum daily average temperature of Silver Creek at County Hwy KK increased from 59.6 dF to 74.5 dF at Hwy 44 upstream of the Gothic Millpond. The maximum daily average temperature of Silver Creek increased from 74.5 dF to 76 dF from upstream of the Gothic Millpond to downstream. The average monthly temperature increased on average 4 dF from upstream of the millpond to downstream between June and September 2014.
Four Unnamed Creeks and Dakin Creek were monitored for temperature in the Silver Creek Watershed in 2014. Each location was monitored once per hour from early May through mid-October, a Dakin Creek recorded the lowest temperatures of the tributaries to Silver Creek with a Maximum Daily Average (MDM) of 65.7F. Unnamed Creek at County KK recorded the highest temperatures of the 5 tributaries in this project, with a MDM of 75F.
Study Discussion
River/Stream Health Silver Creek watershed and the Southern Big Green watershed are associated with the Southeast Glacial Plains. The land use for the Southeast Wisconsin Till Plains (SWTP) is dominated by cropland. The creeks in this study have low to high clay soil content and are low to high in gradient, which is likely the driver behind cropland-dominated land use. The clay content of the soils in the SWTP has had a strong effect on the water quality of Midwestern streams (USGS 2006). Typically, as increases in agricultural land use occur, there is a correlating increase in TP concentration in creeks in the watershed. Water clarity (secchi depths) decreases and chlorophyll a concentration (which is an indication of algae populations) increases as TP and TDP increases. Water clarity and chlorophyll a concentration are indicators of water quality in Wisconsin lakes (WisCALM 2018).
Reference average stream conditions for the SWTP ranged from 0.080 mg/L (USEPA 2000-2001) to 0.042 mg/L TP (USGS 2006). Three of the four average TP concentrations in the Southern Big Green watershed were above the modeled reference conditions (USEPA 2000-2001 & USGS 2006). Eight of the 11 average TP concentrations in the Silver Creek watershed were above the modeled reference conditions (USEPA 2000-2001 & USGS 2006). The land use in this study area has had a significant impact on the TP in 3 of the 4 creeks. Response thresholds of water quality to changes in nutrient concentrations for macroinvertebrates in Wisconsin wadeable streams are 0.088 mg/L for TP (USGS 2006). In general, that means a small increase in nutrient concentration before reaching that threshold concentration results in a relatively large change to the macroinvertebrate and fish communities. Two of the 4 sites in the southern Big Green Lake watershed demonstrated TP concentrations over response thresholds of water quality (USGS 2006). Eight of the 11 sites in the Silver Creek watershed demonstrated TP LCL concentrations over response thresholds of fish (USGS 2006). Three of the 11 Silver Creek sites demonstrated TP LCL concentrations over response thresholds of macroinvertebrates (USGS 2006). Water quality has been impacted by the TP concentrations in the creeks of this project.
This TWA project addressed needs for baseline water quality monitoring in the Southern Big Green Lake and Silver Creek watersheds. Repeatable biological, inorganic chemistry and habitat surveys provide valuable information for future comparison. This project filled data gaps from the 2011 Assessment Report of Hill, Roy, and Wuerches Creeks (Johnson et. al. 2011) (2011 Assessment). Together with the 2011 Assessment, the data collected in this project can be compared to future surveys to evaluate the effectiveness of Best Management Practices (BMPs) installed in the watershed. Due to the nature of watershed water holding capacity, flood events, soil types, creek habitat, sediment deposition, and many other factors, BMPs may have an immediate and identifiable water quality impact while others may take years (20+) to see any kind of positive impact. Therefore, some short-term (3-year period) comparison of the data collected in this project can be done to the 2011 Assessment Report of Hill, Roy, and Wuerches Creeks (Johnson et. al. 2011) and data collected by USGS at Roy and White Creeks (USGS 2012-2014).
Since 2011, BMPs have been installed in the southern Big Green Lake HUC 12 watershed to mitigate some of the sediment and nutrient loading into the creeks and Big Green Lake. Wuerches, Roy, Hill and White Creeks had historic TP data prior to this project. Wuerches, Roy, and Hill Creeks were monitored for TP by Johnson in 2011. Roy Creek has had a USGS Gauge Station 04073458 collecting TP and flow data since 2012 through 2014 and White Creek had a USGS Gauge Station 04073462 through the 2012 growing season. Spring, Hill, and the two Unnamed Tributaries to Hill and White Creeks were monitored as part of this 2014 project. The two Hill Creek data years are comparable due to the similar number of sampling events and dates. The Hill Creek TP average concentration increased from 0.107 mg/L to 0.145 mg/L in 2011 and 2014, respectively. There was also less variability in the TP concentrations during the growing season of 2014 versus 2011 in Hill Creek. Both years average TP data on Hill Creek exceeded the WQC of 0.075 mg/L.
Hill Creek was added to the 2016 CWA 303d Impaired Waters List for degraded biological community due to the pollutant phosphorus on 4/1/2016. White Creek 2011 data is fairly comparable to the 2012 data. There were significantly more sampling events in 2012 than 2011 in White Creek in the DNR SWIMS database, but the average concentration was about the same. The 2014 Roy Creek data is difficult to compare to other years as a significant (80%) portion of the sampling events occurred during June when there was high runoff and flow. The average TP concentration in the available data for 2014 at Roy Creek was significantly higher than 2011 and 2013 due to the high number of sampling events in June.
A summary of historical macroinvertebrate results was listed for 4 locations in 2011 in the Big Green Lake Watershed (Johnson et. al. 2011). Three of 4 of the 2011 streams were monitored as part of this project: Roy Creek, Hill Creek, and Wuerches Creek. The MIBI scores from 2014 are fairly similar to historical surveys. The largest difference between historical scores and 2014 scores was a 2.7 decrease in biotic integrity at Roy Creek upstream of County Hwy O. That difference may be the result of recent habitat improvement work where the sample was collected. The macroinvertebrate community may not have recovered yet from the disturbance and changes made to the habitat in early 2013. In the 2011 Assessment, Johnson reports the macroinvertebrate survey results in the form of Hilsenhoff Biotic Index (HBI) score which refers to William H. Hilsenhoff 1987 An improved biotic index of organic stream pollution. One of the basic differences between reading the HBI scores versus the MIBI scores is that the higher the MIBI the better condition while the higher the HBI the poorer the condition. One of the fundamental differences between the HBI and MIBI is that the HBI focuses more on impacts to the macroinvertebrate community from organic pollution and increased nutrients while the MIBI also ties in impacts from habitat degradation. The historical HBI scores were fairly similar to the 2014 HBI scores, with the largest difference 0.6.
Fish Community
Fish surveys were conducted in 2011 by the DNR in Roy and Wuerches Creeks (Johnson et. al. 2011). This TWA project also conducted fish surveys at those two locations. The FIBI were similar from 2011 to 2014 with all condition categories listed as Poor (Figure 24).
Total Phosphorus The inorganic chemistry data collected during this project established that instream TP concentrations were above reference conditions; therefore, an impairment assessment was conducted to evaluate if NR 102 WQC were being met or if the creeks should be placed on the CWA 303d Impaired Waters List. The requirements to demonstrate if WQC for TP were being met, clearly exceeded, or overwhelmingly exceeded were accomplished through this project. WisCALM 2018 requires that a minimum of 6 monthly samples for TP from May through October occur within two years to have sufficient data to calculate the LCL.
None of the 4 creeks in Southern Big Green watershed overwhelmingly exceeded (LCL 2X 0.075 mg/L) the TP WQC. One of the 4 creeks exceeded the TP WQC, but did not overwhelmingly exceed. According to impairment assessment protocol (WisCALM 2018), biological confirmation was needed to determine which CWA 303d listing was necessary. The 2011 aquatic macroinvertebrate sample scored in the Poor condition category (Figure 12). The Poor HBI score together with the TP LCL exceeding the WQC indicates that Hill Creek should be CWA 303d listed for degraded biological community due to pollutant TP (Category 5A) (Table 23). The two Unnamed Tributaries and Spring Creek should not be CWA 303d listed for TP.
Two of the 4 locations sampled from the Silver Creek Mainstem exceeded the TP WQC, but did not overwhelmingly exceed. None of the macroinvertebrate and fish surveys in Silver Creek Mainstem indicated a condition category of Poor (besides the FIBI at County KK). Therefore, the requirements for listing Silver Creek as Impaired due to degraded biological community from the pollutant phosphorus was not met (Table 26). None of the seven tributaries TP LCLs overwhelmingly exceeded the WQC (>0.15 mg/L TP). Four of the 7 TP LCLs exceeded the WQC but did not overwhelmingly exceed (>0.075<1.5 mg/L). Biological confirmation was needed to determine which CWA 303d listing was necessary for the 4 tributaries. The 2013 fish survey and the 2014 macroinvertebrate survey (Table 16, Figure 14) at the Unnamed Tributary to Silver Creek (WBIC 5026964) at Arcade Rd scored in the Poor condition category. The 2014 fish survey at the Unnamed Tributary to Silver Creek (WBIC 146900) scored in the Poor condition category (Table 19, Figure 18). The Poor IBI scores together with the TP LCLs exceeding the WQC indicate that the two Unnamed Tributaries to Silver Creek (WBIC 5026964 & 146900) should be CWA 303d listed for degraded biological community due to pollutant TP (Category 5A). The Unnamed Tributary to Silver Creek at County FF and County KK were recommended for the 2016 Impaired Waters List due to the pollutant phosphorus. The phosphorus levels in 2014 (Table 9 and 12, Figure 7 & 10) led to that recommendation for listing.
Habitat Degradation
Habitat degradation by sedimentation is also a common driver of fish and aquatic life use impairments due to the nature of the land use in the SWTP. Sediment (specifically TSS) is the pollutant that must be addressed to attain the designated use. Fine sediment covers the creek substrate and fills in pools, reducing the suitable habitat for fish and macroinvertebrate communities. Filling-in of pools reduces the amount of available cover for juvenile and adult fish. Sedimentation of riffle areas reduces the reproductive success of fish by reducing the exposed gravel substrate necessary for appropriate spawning conditions. Suspended sediment also increases turbidity, reducing light penetration necessary for photosynthesis in aquatic plants. Increased turbidity also reduces the feeding efficiency of visual predators and filter feeders, and lowers the respiratory capacity of aquatic invertebrates by clogging their gill surfaces.
To conduct an impairment assessment of each of these creeks based upon habitat degradation by sedimentation, biological and quantitative habitat surveys were conducted in 2014. Roy, Wuerches, and Hill Creeks were previously CWA 303d listed for habitat degradation due to sedimentation. The FIBI calculation in the Unnamed Tributary to Hill Creek indicated a Condition Category of Poor when compared to reference Wisconsin Coldwater fish communities. The fish survey conducted on 7/09/2014 captured no fish in a representative survey station.
Quantitative habitat survey was conducted on 09/10/2014 which indicated an overall score of 48, which is in the Fair condition category. The habitat survey indicated specific aspects of the tributary�s habitat which contributed to the Poor FIBI. The habitat score was brought down due to no available game fish cover, high percentage of fine sediment, moderate bank erosion, and low bend to bend ratio. Based upon the Poor FIBI score, poor/fair instream habitat, and my best professional judgment, the Unnamed Tributary to Hill Creek should be listed as Impaired (Category 5A) with the impairment degraded habitat and the pollutant TSS (Table 25). In addition, three of the Unnamed Tributaries to Silver Creek were recommended to be added to the CWA 303d list for degraded habitat (Category 5A).
Sediment and Phosphorus Sources
Some of the sources of sedimentation, phosphorus, increased temperatures, and decreased biotic integrity in Silver Creek and the Unnamed Tributaries are streambank erosion, agriculture tile drainage, urban and construction site runoff, fish barriers, minimal buffer widths, and stream channelization. The poor to fair FIBI and MIBI scores reflect the effects of habitat degradation, sedimentation, and high nutrient loads from the subwatersheds.
One of the largest sources of sedimentation and phosphorus in Roy, Wuerches, Hill, and White Creeks, and their associated Unnamed Tributaries is excessive stream bank erosion. The poor to fair FIBI scores reflect the effects of sedimentation and high nutrient loads in the Southern Big Green Lake watershed. Green Lake County LCD conducted an inventory of Roy, Wuerches, Hill, and White Creeks, and their associated Unnamed Tributaries to assess the condition of their riparian buffers, stream bank erosion, and instream habitat. The Green Lake County Soil Conservation Technician (D. Kavanaugh) completed a summary report of the 2014 buffer assessment, �Green Lake Buffer Assessment Project� (Buffer Assessment Report, Kavanaugh, 2014). In the report Roy, Wuerches, Hill, and White Creek subwatersheds averaged 11.25% of their stream length had unstable banks with active erosion (Buffer Assessment Report 2014).
According to data collected at the USGS Gage Station 04073458, Roy Creek discharged a total of 240 tons of suspended sediment and 740 lbs. of TP in 2013 (USGS 2013). The majority of this sediment and nutrient discharge occurred in early spring during snowmelt and rain events. Rain events and snowmelt carry sediment and TP into the creek in addition to increasing water velocity and discharge volume. The increased velocity and discharge during this period increases the potential for bank erosion on the unstable banks in the subwatersheds.
Management Recommendations
1. The department should work with watershed organizations on outreach efforts with landowners in the watershed, environmental programs in Big Green Lake watershed, and research opportunities for stream bank stabilization opportunities.
2. The department should work to increase buffer widths in all of these subwatersheds will likely have a nutrient and sediment reduction effect.
Monitoring Recommendations
1. Hill Creek should be added to the states impaired waters list as the total phosphorus exceeds standards and there is biological confirmation (Category 5A water) based on WisCALM 2016.
2. The unnamed tributary to Hill Creek should also be added to the state impaired waters list as the total phosphorus exceeds standards and there is biological confirmation (Category 5A water) based on WisCALM 2016.
3. Continue monitoring of phosphorus, macroinvertebrate and fisheries values in streams of the Big Green Lake watershed as funding and volunteer efforts allow.
Watershed Recommendations
Watershed Based List of Projects and Links in UF07
Partner Recommendations
1. DNR, county and local partners should work to obtain funds or grants to restore the identified unstable stream banks to reduce sedimentation and erosion in the watershed (Wuerches, Roy and Hill, White Creek).
2. Management agencies and landowners in the watershed should work toward enhancing a combination of forest and native grass buffers, which may have a better nutrient reduction than strictly grassed buffers.
3. Implement cover crops to reduce cropland erosion during late fall and spring.
4. Replace perched culverts in the watershed to increase available fish and aquatic life habitat.
5. Mitigate impacts from the Gothic Mill Dam in Ripon on water temperature and fish migration in Silver Creek.
Monitoring and Planning
This Water Quality Management Plan was created under the state�s Water Quality Management Planning and Water Resources Monitoring Programs. The plan reflects Water Quality Bureau and Water Resources Monitoring Strategy 2015-2020 goals and priorities and fulfills Areawide Water Quality Management Planning milestones under the Clean Water Act, Section 208. Condition information and resource management recommendations support and guide program priorities for the plan area. This plan is hereby approved by the Wisconsin DNR Water Quality Program and is a formal update to the Upper Fox River Basin Wisconsin Areawide Water Quality Management Plan and Wisconsin�s Statewide
Areawide Water Quality Management Plan. This plan will be forwarded to USEPA for certification as a
formal plan update.
Related Studies, Plans
Watershed Based List of Projects and Links in UF07
Contributors
Dave Bolha, Primary Author and Investigator, Eastern District, Wisconsin DNR
Victoria Ziegler, Program Support, Water Quality Bureau, Wisconsin DNR
Lisa Helmuth, Program Coordinator, Water Quality Bureau, Wisconsin DNR
References
Hilsenhoff, William L. 1987. An Improved Biotic Index of Organic Stream Pollution. Great Lakes Entomologist. 20: 31-39.
Kavanaugh. 2014. Green Lake Buffer Assessment Project: An Assessment of Current Riparian Buffer and Stream
Conditions in Select Sub-Watersheds of Green Lake. Green Lake County Land Conservation Department
Lyons, John. 1992. Using the Index of Biotic Integrity (IBI) to Measure Environmental Quality in Warmwater Streams of Wisconsin. US Department of Agriculture. Technical Report NC-149.
Lyons, John. 2006. A Fish-based Index of Biotic Integrity to Assess Intermittent Headwater Streams in Wisconsin, USA. Environmental Monitoring and Assessment 122: 239-258.
Lyons, John. 2008. Using the Wisconsin Stream Model to Estimate the Potential Natural Community of Wisconsin Streams (DRAFT). Wisconsin Department of Natural Resources Fish and Aquatic Life Research Section. November, 2008.
Lyons, John. T. Zorn, J. Stewart, P Seelbach, K Wehrly, and L. Wang. 2009. Defining and Characterizing Coolwater Streams and Their Fish Assemblages in Michigan and Wisconsin, USA. North American Journal of Fisheries Management. 29:1130-1151.
Lyons, John. 2012. Development and Validation of Two Fish-based Indices of Biotic Integrity for Assessing Perennial Coolwater Streams In Wisconsin, USA. Ecological Indicators 23 (2012) 402-412.
Lyons, John. 2013. Methodology for Using Field Data to Identify and Correct Wisconsin Stream �Natural Community� Misclassifications. Version 4. May 16, 2013. IN DRAFT.
Simonson, Timothy D., J. Lyons, and P.D. Kanehl. 1994. Guidelines for Evaluating Fish Habitat in Wisconsin Streams.
U.S. Department of Agriculture. Forest Service. Technical Report NC-164.
USGS (United States Geological Survey) (Robertson, D.M. et. al.). 2006. Nutrient Concentrations and Their Relations to the Biotic Integrity of Wadeable Streams in Wisconsin.
USGS (United States Geological Survey). 2012-2014. Real-time data for USGS Station 04073458 Roy Creek Near Roy Creek Road Near Green Lake, WI. USGS Water Resources of Wisconsin. 2014.
WDNR (Wisconsin Department of Natural Resources) (Johnson et. al.). 2011. An Assessment of Hill, Roy, Silver, and Wuerches Creeks (303d Impaired Waters).
WDNR (Wisconsin Department of Natural Resources). 2014. Total Phosphorus Sampling Methods: Water Action Volunteers Manual 2014.
WDNR (Wisconsin Department of Natural Resources). 2000. Guidelines for Collection Macroinvertebrate Samples from Wadable Streams.
WDNR (Wisconsin Department of Natural Resources). 2002. Guidelines for Evaluating Habitat of Wadable Streams.
WDNR (Wisconsin Department of Natural Resources). 2001. Guidelines for Assessing Fish Communities of Wadable Streams in Wisconsin.
WDNR (Wisconsin Department of Natural Resources). 2017. Wisconsin Consolidated Assessment and Listing Methodology Guidance Document. Clean Water Act Section 305(b), 314, and 303(d) Integrated Reporting. WDNR. September, 2017.
WDNR. 1980. Surface Water Resources of Green County. By D. Bush, R. Cornelius, D. Engel, C. Brynildson. Wisconsin Department of Natural Resources. Madison, WI.
Weigel, Brian. 2003. Development of Stream Macroinvertebrate Models That Predict Watershed and Local Stressors in Wisconsin. Journal of North American Benthological Society. 22(1): 123-142.
Abbreviations
AEL: Aquatic Entomology Laboratory at UW � Stevens Point. The primary laboratory for analysis of macroinvertebrate taxonomy in the State of Wisconsin.
BMP: Best Management Practice. A practice that is determined effective and practicable (including technological, economic, and institutional considerations) in preventing or reducing pollution generated from nonpoint sources to a level compatible with water quality goals.
DNR: Department of Natural Resources. Wisconsin Department of Natural Resources is an agency of the State of Wisconsin created to preserve, protect, manage, and maintain natural resources.
FHMD: Fisheries and Habitat Management Database. Wisconsin�s repository for fish taxonomy and auto-calculated metrics involving fish assemblage condition and related.
FIBI: Fish Index of biological integrity (Fish IBI). An Index of Biological Integrity (IBI) is a scientific tool used to identify and classify water pollution problems. An IBI associates anthropogenic influences on a water body with biological activity in the water and is formulated using data developed from biosurveys. In Wisconsin, Fish IBIs are created for each type of natural community in the state�s stream system.
HUC: Hydrologic Unit Code. A code or sequence of numbers that identify one of a number of nested and interlocked hydrologic catchments delineated by a consortium of agencies including USGS, USFS, and Wisconsin DNR.
MIBI: Macroinvertebrate Index of biological integrity. In Wisconsin, the MIBI, or macroinvertebrate Index of biological integrity, was developed specifically to assess Wisconsin�s macroinvertebrate community (see also Fish IBI). Natural Community. A system of categorizing waterbodies based on their inherent physical, hydrologic, and biological assemblages. Both Streams and Lakes are categorized using an array of �natural community� types.
NRCS: USDA Natural Resources Conservation Service. The federal agency providing local support and land management outreach work with landowners and partners such as state agencies.
SWIMS ID. Surface Water Integrated Monitoring System (SWIMS) Identification Code is the unique monitoring station identification number for the location where monitoring data was gathered.
TDP: Total Dissolved Phosphorus. An analyzed chemistry parameter collected in aquatic systems positively correlated with excess productivity and eutrophication in Wisconsin waters.
TP: Total Phosphorus. An analyzed chemical parameter collected in aquatic systems positively correlated with excess productivity and eutrophication in Wisconsin waters.
TSS: Total suspended solids. An analyzed physical parameter collected in aquatic systems that is frequently positively correlated with excess productivity, reduced water clarity, reduced dissolved oxygen and degraded biological communities.
TWA: Targeted Watershed Assessment. A statewide study design a rotating watershed approach to gathering of baseline monitoring data with specialized targeted assessments for unique and site specific concerns, such as effectiveness monitoring of management actions.
WATERS ID: The Waterbody Assessment, Tracking and Electronic Reporting System Identification Code (WATERS ID) is a unique numerical sequence number assigned by the WATERS system, also known as �Assessment Unit ID code�.
WBIC: Water Body Identification Code. DNR�s unique identification codes assigned to water features in the state. The lines and information allow the user to execute spatial and tabular queries about the data, make maps, and perform flow analysis and network traces.
WISLOH: Wisconsin State Laboratory of Hygiene. The state�s certified laboratory that provides a wide range of analytical services including toxicology, chemistry, and data sharing.