Barron
No
No
No
Fish and Aquatic Life
Overview
The Red Cedar River originates in southwestern Sawyer County and flows south into the Chippewa River in southern Dunn County. It drains portions of seven counties: Barron, Chippewa, Dunn, Polk, Rusk, Sawyer, St. Croix and Washburn. The Red Cedar River and its tributaries drain eight of the 24 watersheds in the Basin. The Red Cedar drainage area makes up a third of the Lower Chippewa River Basin, nearly 1,900 square miles. Land use ranges from mostly forested in the north to predominantly agricultural in the south. The Red Cedar River drainage area is located in the North Central Hardwood Forest Ecoregion (Omernik and Gallant, 1988). This EPA ecoregion is characterized by nearly level to rolling glacial till plains and significant agricultural land use. Within this area there are approximately 255 streams with a total length of 1,302 mi. Of these 141 are unnamed creeks and ditches. The average gradient for the Red Cedar River is 4.6 ft/mi. The average discharge at Menomonie (94% of drainage area) is 1,235 cubic feet/sec. The Red Cedar River bottom is composed primarily of sand, gravel, and rubble with limited areas of boulder, bedrock, muck and silt. Land use in this sub-basin ranges from mostly agriculture (64%) in the south to predominately forest (27%) in the north. Red Cedar Lake, Rice Lake, Tainter Lake and Lake Menomin are large man-made impoundments on the Red Cedar River. The river also receives water via tributaries from other impoundments including Beaver Dam Lake, Long Lake, Bear Lake and Lake Chetek.
Water Quality: Documented water quality problems related to phosphorus include impoundment eutrophication and dissolved oxygen problems in heavily vegetated stream reaches. Tainter Lake and the Red Cedar River above Tainter Lake suffer from high levels of mercury in sport fish and are subject to consumption advisories.
Water quality problems related to phosphorus have been documented in the Red Cedar River system; impoundment eutrophication (Schreiber 1992; Dunn Co. LWCD, 1992) and dissolved oxygen depletion take place in heavily vegetated stream reaches (Borman and Schreiber 1992). While these problems were evaluated in detail only in Tainter Lake and the Red Cedar River below Rice Lake, they likely exist in other, similar environments elsewhere in the sub-basin.
The U.S Environmental Protection Agency provided funding for further evaluation of the frequency, extent and duration of these problems as well as an evaluation of the significance of point and nonpoint sources of phosphorus in the seven upper watersheds (LC05-LC11). The goal of the project was to develop an implementation plan for phosphorus control in the basin, based on site-specific impacts to waterbodies. Project stakeholders include local governments, municipalities, industries and water user groups.
Voss, Karen and Sarah Beaster. 2001. The State of the Lower Chippewa River Basin. PUBL-WT-554 2001. Wisconsin Department of Natural Resources, Madison, WI.
Date 2001
Author Mark Hazuga
General Condition
Red Cedar River, from the Brill River to headwaters at Red Cedar outlet (miles 95.65 to 101.41), was evaluated in the 2014, 2018, and 2020 cycles for metrics including phosphorus, chloride, and biology; conditions were good. This river segment is on the Healthy Waters List.
Date 2022
Author Ashley Beranek
General Condition
Red Cedar River, from Rice Lake inlet to Brill River (miles 89.89 to 95.65), was on the impaired waters list from 2006 to 2008 for Mercury and PCBs in fish tissue. Phosphorus and biology were evaluated in the 2014, 2018, and 2020 cycles and no impairment was found. This river segment is on the Healthy Waters List.
Date 2022
Author Ashley Beranek
General Condition
Red Cedar River, from CTH W to Rice Lake inlet (miles 79.22 to 89.89), was on the impaired waters list from 1998 to 2008 for Mercury and PCBs in fish tissue. Phosphorus and biology were evaluated in the 2018 cycle and no impairment was found. This river segment is on the Healthy Waters List.
Date 2022
Author Ashley Beranek
General Condition
Red Cedar River, from I-94 to Tainter Dam (miles 18.80 to 22.51), has not been evaluated for water quality.
Date 2022
Author Ashley Beranek
General Condition
Two large impoundments in ths watershed, Tainter Lake and Lake Menomin, greatly influence the water quality of the Red Cedar River. Detrimental effects include high chlorophyll levels, which contribute to daily dissolved oxygen fluctuations in the river.
In July 1988, dissolved oxygen data recorded at the village of Inrington, below Lake Menomin, showed fluctuations between 5.5 and 13.5 milligrams per liter (LaLiberte, 1993). Elevated water temperatures from the impoundments could also influence the lower Red Cedar River.
Increased nutrient levels in the lower stretch of the Red Cedar River have their origins well upstream of the lakes. In the summer of 1994, a sewer line ruptured in the Red Cedar River channel, resulting in the discharge of raw sewage to the river. Due to quick action by the city of Menomonie and the hgh flow of the river, the amount of spilled sewage did not affect water quality. There is always a possibility of sewer line breakage at river crossings. It is imperative that an emergency response plan be outlined for such situations. Beatrice Co. Swiss Miss Plant was recently recognized eff om. By switchng to different cleaning solutions, the by the WDNR for its pollution prevention plant reduced phosphorous concentrations in its effluent by 85 percent. This plant discharges its process wastes to the Menomonie wastewater treatment plant (Thon) . The amount of ammonia contributed by the Menomonie wastewater treatment plant has the potential to affect the fishery during low flows. Standards and policies for ammonia are under revision (LaLiberte 19%).
The extreme lower end of the Red Cedar River is part of the Dunville State Wildlife Area. Ths area extends along the northern shore of the Chippewa River upstream and downstream of the Red Cedar River into the Muddy and Elk Creeks Watershed (LC13) and the Eau Galle River Watershed (LCO3).
Date 1996
Author Christopher Willger
General Condition
Numerous reports were received by area fisheries managers regarding the apparent disappearance of red-tailed shmers and other minnows in the Red Cedar River below Rice Lake in 1990 and 1992. A toxicity test conducted by the city of Rice Lake wastewater treatment plant during this period showed toxicity to fathead minnows from background river water, but not from treatment plant effluent. Fishery surveys conducted in 1993 indicated normal minnow populations (WDNR).
A 1992 WDNR report found that phosphorus loading from the Rice Lake wastewater treatment plant doubled the phosphorus concentration of the Red Cedar River during low flow conditions in the river.
High phosphorus concentrations in the river support heavy rooted aquatic plant growth, which was found to cause night time dissolved oxygen concentrations to fall below water quality standards at downstream sites. The city of Rice Lake operates an activated sludge wastewater treatment plant which discharges to the Red Cedar downstream of the dam that forms Rice Lake. The present permit requires that the city provide 180 days of sludge storage. The neM permit issuance will require phosphorus removal, as the plant discharges more than 150 ~ounds of phosphorus per month, which is the threshold level for providing removal under NR 217 Wis. Adm. Code.
Date 1996
Author Christopher Willger
General Condition
A comprehensive survey of the Red Cedar River in this watershed, conducted from 1989 to 1990, revealed that the Chetek River, which drains into the Red Cedar River at the watershed boundary, carries a high nutrient and algae load. The impacts are visible in the Red Cedar River for some distance below the confluence. Extreme fluctuations of dissolved oxygen have been documented due to plant photosynthesis and respiration. Fluctuations of dissolved oxygen are potentially dangerous to fish and aquatic life. The river is fairly well buffered from immediate agricultural land use, although bank erosion is evident. A healthy forage, walleye and smallmouth bass fishery exists in ths portion of the Red Cedar River. It is likely that Tainter Lake walleye use the Red Cedar River for spawning because of quality riffle areas (Holzer) .
A study conducted to update estimates of the phosphorus entering Tainter Lake (LCO4) and determine the relative contribution of phosphorus from pollutant sources from the Red Cedar and Hay Rivers concluded that reducing the phosphorus input from significant point source discharges in the watershed would, alone, have minimal impact on water quality in Tainter Lake. If, however, a significant reduction in point source loading is combined with implementation of extensive controls of polluted runoff water quality in Tainter Lake would improve (Schreiber).
Recommendations from the phosphorus reduction study include developing a comprehensive watershed management plan to determine the feasibility and means of reducing the phosphorus load to Tainter Lake, establishing a phosphorus monitoring station, and verifying and rerunning the model used for Tainter Lake if more data becomes available.
Date 1996
Author Christopher Willger
Impaired Waters
Red Cedar River, from its mouth at the Chippewa River to Little Elk Creek (miles 0 to 9.27), has been listed for PCBs in fish tissue since 1998. This segment of the Red Cedar River was evaluated for phosphorus and biology every two years between 2014 and 2018. Phosphorus levels were found to be too high in both cycles.
Date 2022
Author Ashley Beranek
Impaired Waters
Red Cedar River, from the Yellow River to CTH W (miles 73.60 to 78.51), has low dissolved oxygen issues as a result of high phosphorus levels. This segment has been listed since 1998.
Date 2022
Author Ashley Beranek
Impaired Waters
Red Cedar River, from Tainter lake inlet to Yellow River (miles 28.72 to 73.60), was evaluated for phosphorus and biology every two years between 2012 and 2018. Phosphorus levels were too high.
Date 2022
Author Ashley Beranek
Impaired Waters
Red Cedar River, from Tainter Dam to Tainter lake inlet (miles 22.51 to 28.72), has elevated pH and issues with algal growth due to high phosphorus levels. This portion of the stream has been listed since 1998.
Date 2022
Author Ashley Beranek
Impaired Waters
Red Cedar River, from Menomin Dam to I-94 (miles 16.48 to 18.80), was evaluated for phosphorus and biology in 2014, 2016, 2020, and 2022. Phosphorus levels were found to be too high, confirming the 1998 phosphorus listing. Chloride levels were appropriately low.
Date 2022
Author Ashley Beranek
Impaired Waters
Red Cedar River, from the first trib above Irving Creek to Menomin Dam (miles 13.56 to 16.48), was listed in the 1998 cycle due to PCB concentrations in fish tissue. This segment of the Red Cedar River was evaluated for phosphorus, biology, and chloride every two years between 2012 and 2022. Phosphorus levels were found to be too high.
Date 2022
Author Ashley Beranek
Impaired Waters
Red Cedar River, from Little Elk Creek to the first trib above Irving Creek (miles 9.27 to 13.56), has been listed for PCBs in fish tissue and total phosphorus causing eutrophication and elevated pH since 1998.
Date 2022
Author Ashley Beranek
Condition
Wisconsin has over 84,000 miles of streams, 15,000 lakes and milllions of acres of wetlands. Assessing the condition of this vast amount of water is challenging. The state's water monitoring program uses a media-based, cross-program approach to analyze water condition. An updated monitoring strategy (2015-2020) is now available. Compliance with Clean Water Act fishable, swimmable standards are located in the Executive Summary of Water Condition in 2018. See also the 'monitoring and projects' tab.
Reports
Recommendations
Shoreland Ordinance
Dunn County proposes to amend or create a shoreland zoning ordinance that complies with the requirements of NR 115, Wisconsin Administrative Code (as revised effective February 1, 2010) and retain existing regulations that exceed the water resource protections of NR 115 or are specific or unique to local needs.
Monitor to Evaluate Projects
DO should be assessed on segment 4 of the Red Cedar River to see if this segment has improved and should be removed from 303(d) list.
TMDL Implementation
Red Cedar River TMDL implementation project.
TMDL (USEPA) Approved
USEPA approval for the Red Cedar River TMDL
TMDL Development
Red Cedar River TMDL
Nine Key Element Plan
The TMDL recommends a 65 percent reduction in phosphorus inputs to the lakes.
Water Quality Planning
A Plan for Water Quality Improvement in the Red Cedar River Nine Key Element Plan
Monitor Fish Tissue
2063500 name Red Cedar River TMDL ID 381 Start Mile 28.72 End Mile 73.6
Monitor Fish Tissue
2063500 name Red Cedar River TMDL ID 281 Start Mile 16.48 End Mile 18.8
Monitor Fish Tissue
2063500 name Red Cedar River TMDL ID 604 Start Mile 73.6 End Mile 78.51
Management Goals
Wisconsin's Water Quality Standards provide qualitative and quantitative goals for waters that are protective of Fishable, Swimmable conditions [Learn more]. Waters that do not meet water quality standards are considered impaired and restoration actions are planned and carried out until the water is once again fishable and swimmable
Management goals can include creation or implementation of a Total Maximum Daily Load analysis, a Nine Key Element Plan, or other restoration work, education and outreach and more. If specific recommendations exist for this water, they will be displayed below online.
Watershed Characteristics
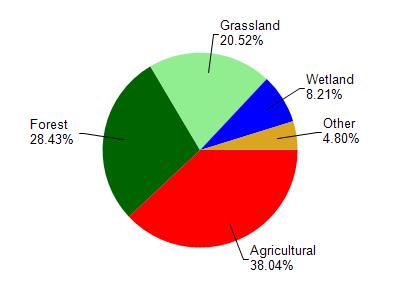
Red Cedar River is located in the Yellow River watershed which is 239.35 mi². Land use in the watershed is primarily agricultural (38%), forest (28.40%) and a mix of grassland (20.50%) and other uses (13.00%). This watershed has 415.31 stream miles, 2,929.80 lake acres and 11,565.29 wetland acres.
Nonpoint Source Characteristics
This watershed is ranked High for runoff impacts on streams, Not Available for runoff impacts on lakes and High for runoff impacts on groundwater and therefore has an overall rank of High. This value can be used in ranking the watershed or individual waterbodies for grant funding under state and county programs.However, all waters are affected by diffuse pollutant sources regardless of initial water quality. Applications for specific runoff projects under state or county grant programs may be pursued. For more information, go to surface water program grants.